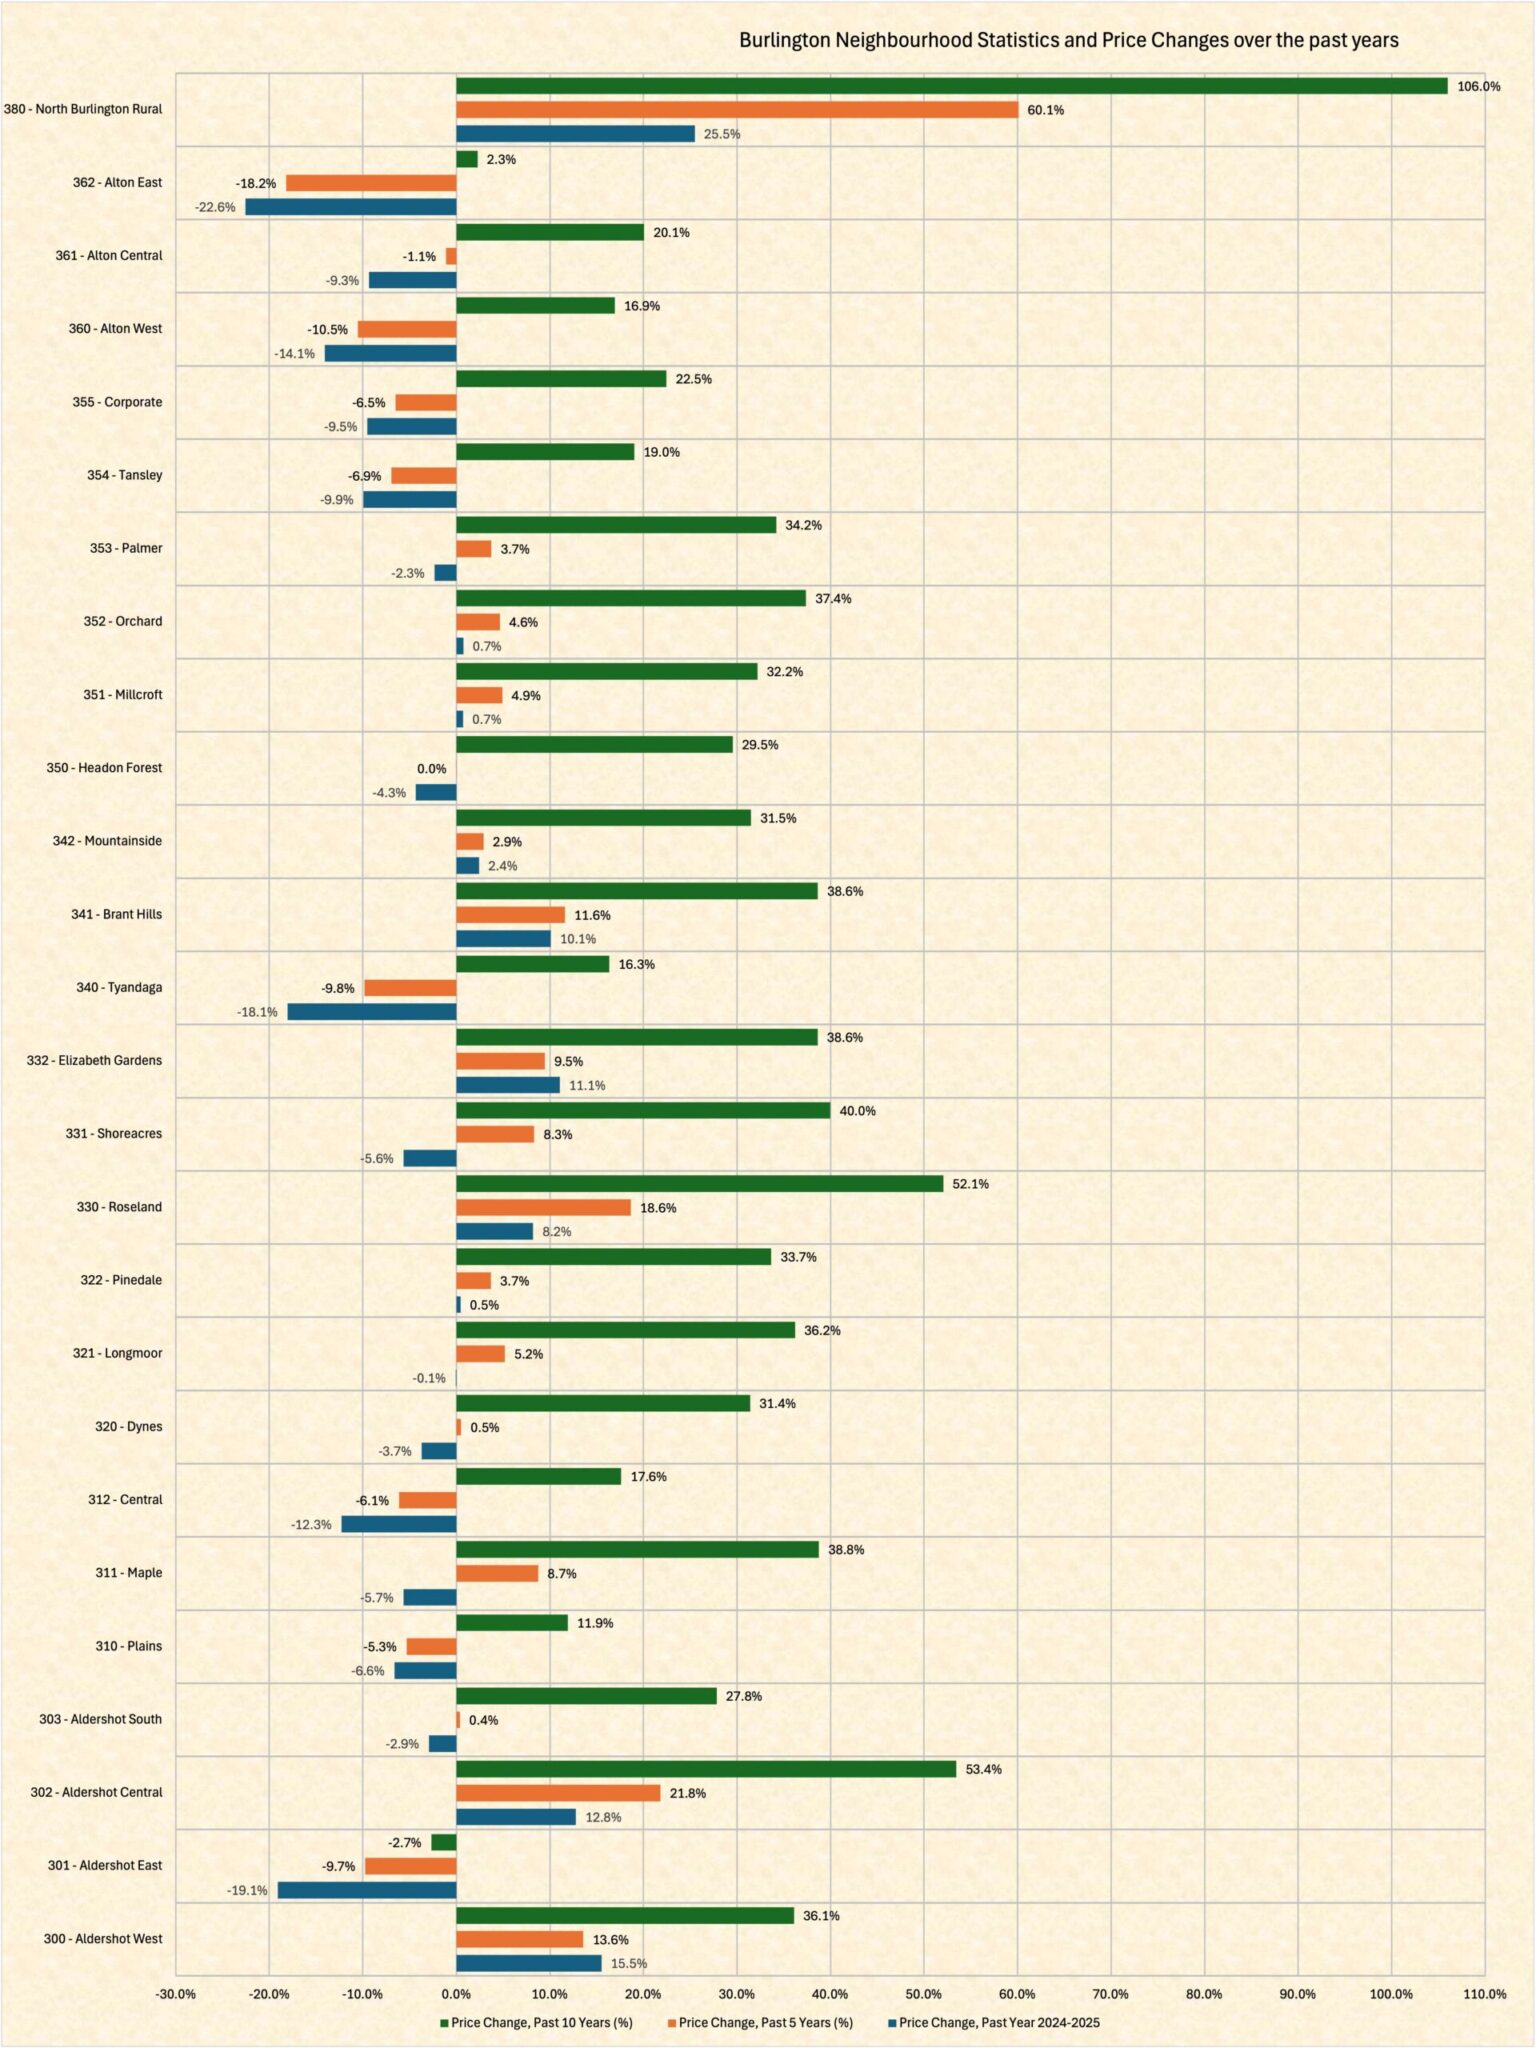
Freehold Residential Sales Statistics
| Neighbourhood | Sale Price, Average 2025 | Sale Price, Average 2024 | % Price Change vs. 2024 | % Price Change vs. 5 years | % Price Change vs. 10 years | Days to Sell, Average 2025 |
|---|---|---|---|---|---|---|
| Aldershot | $1,360,833 | $1,206,614 | 12.8% | 21.8% | 53.4% | 18.0 |
| Aldershot East | $1,097,500 | $1,356,667 | -19.1% | -9.7% | -2.7% | 23.0 |
| Aldershot South | $1,521,181 | $1,567,005 | -2.9% | 0.4% | 27.8% | 59.0 |
| Aldershot West | $1,373,725 | $1,189,208 | 15.5% | 13.6% | 36.1% | 33.0 |
| Alton | $1,312,500 | $1,447,505 | -9.3% | -1.1% | 20.1% | 27.0 |
| Alton East | $960,000 | $1,239,625 | -22.6% | -18.2% | 2.3% | 17.0 |
| Alton West | $1,057,344 | $1,230,367 | -14.1% | -10.5% | 16.9% | 21.0 |
| Brant Hills | $1,146,313 | $1,041,405 | 10.1% | 11.6% | 38.6% | 16.0 |
| Central | $1,301,223 | $1,483,419 | -12.3% | -6.1% | 17.6% | 26.0 |
| Corporate | $854,800 | $938,495 | -9.5% | -6.5% | 22.5% | 21.0 |
| Dynes | $1,196,495 | $1,232,876 | -3.7% | 0.5% | 31.4% | 16.0 |
| Elizabeth Gardens | $1,325,292 | $1,193,342 | 11.1% | 9.5% | 38.6% | 25.0 |
| Headon Forest | $1,236,080 | $1,292,023 | -4.3% | 0.0% | 29.5% | 25.0 |
| Longmoor | $1,079,833 | $1,080,472 | -0.1% | 5.2% | 36.2% | 22.0 |
| Maple | $1,323,992 | $1,403,381 | -5.7% | 8.7% | 38.8% | 14.0 |
| Millcroft | $1,542,692 | $1,531,796 | 0.7% | 4.9% | 32.2% | 25.0 |
| Mountainside | $970,670 | $947,738 | 2.4% | 2.9% | 31.5% | 20.0 |
| North Burlington Rural | $3,484,750 | $2,776,137 | 25.5% | 60.1% | 106.0% | 54.0 |
| Orchard | $1,288,511 | $1,279,156 | 0.7% | 4.6% | 37.4% | 19.0 |
| Palmer | $1,051,533 | $1,076,614 | -2.3% | 3.7% | 34.2% | 21.0 |
| Pinedale | $1,118,781 | $1,113,737 | 0.5% | 3.7% | 33.7% | 11.0 |
| Plains | $851,000 | $911,190 | -6.6% | -5.3% | 11.9% | 22.0 |
| Roseland | $2,481,944 | $2,293,634 | 8.2% | 18.6% | 52.1% | 36.0 |
| Shoreacres | $1,954,344 | $2,071,009 | -5.6% | 9.5% | 40% | 13.0 |
| Tansley | $974,575 | $1,082,181 | -9.9% | -6.9% | 19.0% | 24.0 |
| Tyandaga | $1,419,000 | $1,731,693 | -18.1% | -9.8% | 16.3% | 30.0 |
| BURLINGTON | $1,357,111 | $1,336,509 | 0.25% | 23.50% | 50.90% | 24.5 |