Freehold Residential Sales Statistics
| Neighbourhood | Sale Price, Average 2025 | Sale Price, Average 2024 | % Price Change vs. 2024 | % Price Change vs. 5 Years | % Price Change vs. 10 Years | Days to Sell, Average 2024 |
|---|---|---|---|---|---|---|
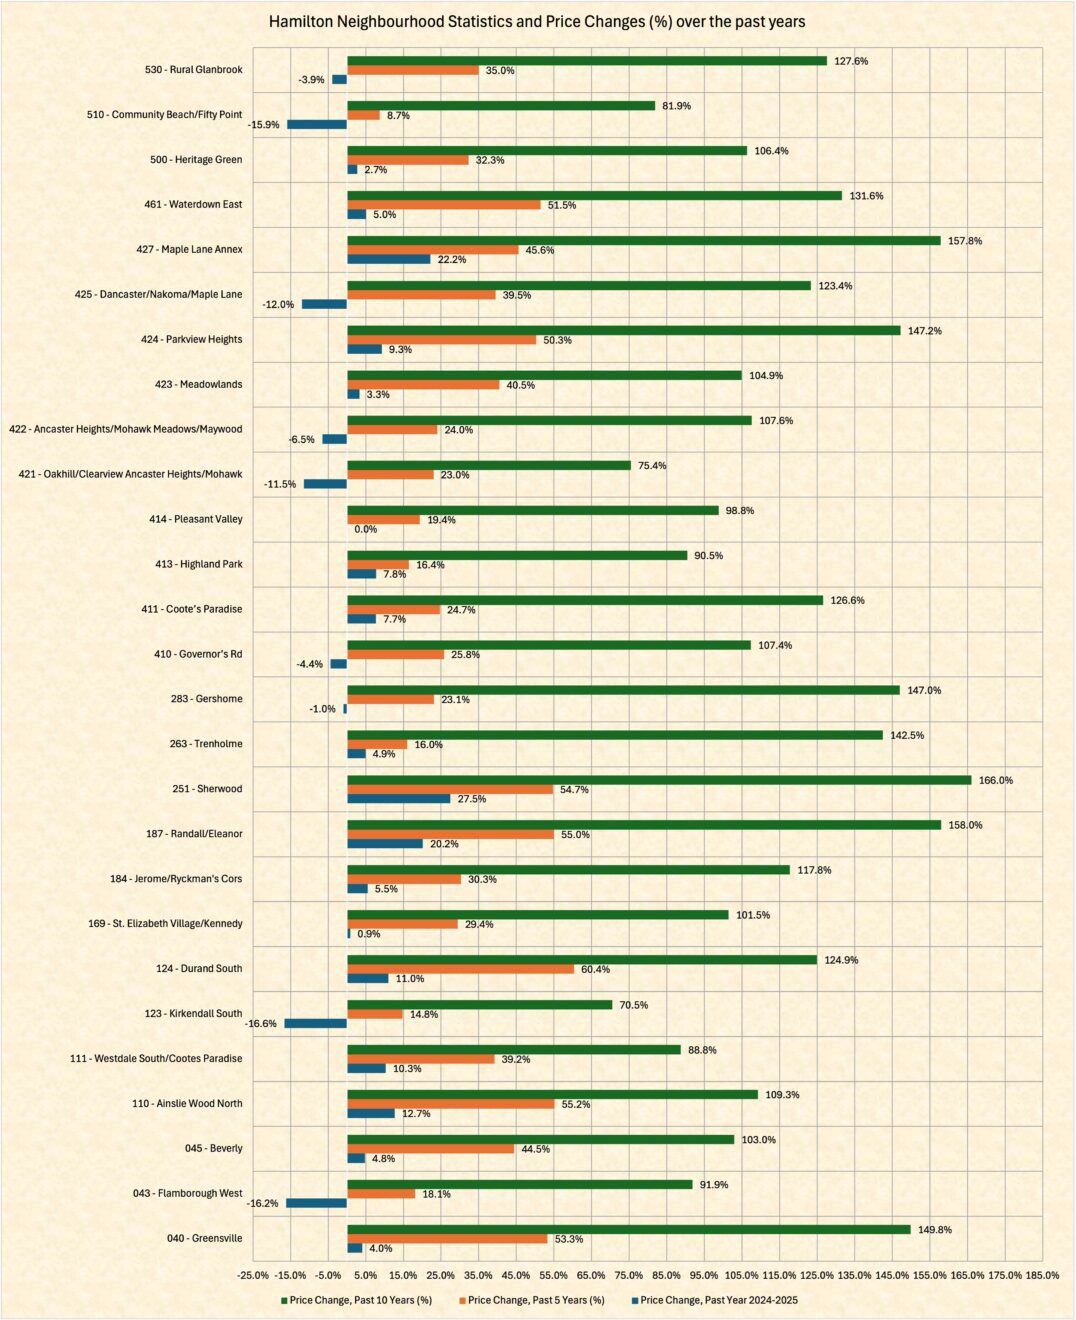
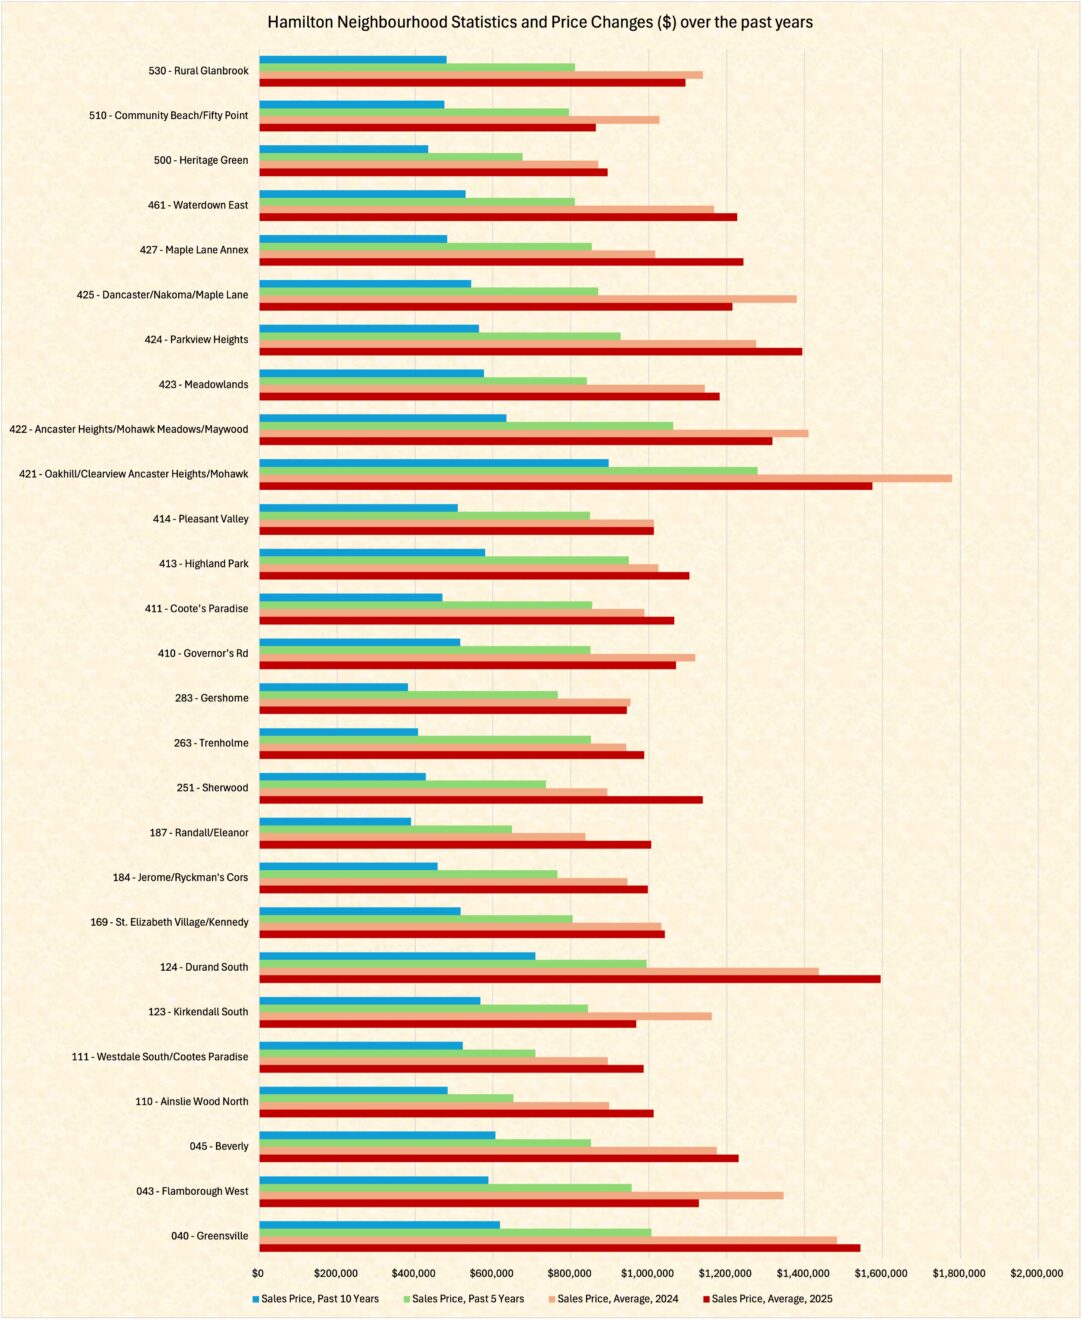
| Greensville | $1,543,333 | $1,483,400 | 4.0% | 53.3% | 149.8% | 35.0 |
| Flamborough West | $1,128,833 | $1,346,255 | -16.2% | 18.1% | 91.9% | 37.0 |
| Beverly | $1,230,714 | $1,174,787 | 4.8% | 44.5% | 103.0% | 36.0 |
| Ainslie Wood North | $1,012,750 | $898,722 | 12.7% | 55.2% | 109.3% | 41.0 |
| Westdale South/Cootes Paradise | $987,000 | $894,956 | 10.3% | 39.2% | 88.8% | 18.0 |
| Kirkendall South | $968,383 | $1,161,787 | -16.6% | 14.8% | 70.5% | 45.0 |
| Durand South | $1,595,000 | $1,436,818 | 11.0% | 60.4% | 124.9% | 36.0 |
| St. Elizabeth Village/Kennedy | $1,041,325 | $1,032,369 | 0.9% | 29.4% | 101.5% | 24.0 |
| Jerome/Ryckman’s Cors | $997,429 | $945,510 | 5.5% | 30.3% | 117.8% | 21.0 |
| Randall/Eleanor | $1,006,286 | $837,352 | 20.2% | 55.0% | 158.0% | 35.0 |
| Sherwood | $1,139,000 | $893,333 | 27.5% | 54.7% | 166.0% | 41.0 |
| Trenholme | $988,000 | $942,000 | 4.9% | 16.0% | 142.5% | 24.0 |
| Gershome | $943,800 | $952,887 | -1.0% | 23.1% | 147.0% | 59.0 |
| Governor’s Rd | $1,070,199 | $1,119,328 | -4.4% | 25.8% | 107.4% | 24.0 |
| Coote’s Paradise | $1,065,462 | $989,263 | 7.7% | 24.7% | 126.6% | 18.0 |
| Highland Park | $1,104,660 | $1,025,125 | 7.8% | 16.4% | 90.5% | 7.0 |
| Pleasant Valley | $1,013,455 | $1,013,128 | 0.0% | 19.4% | 98.8% | 19.0 |
| Oakhill/ Clearview Ancaster Heights/ Mohawk | $1,574,083 | $1,778,633 | -11.5% | 23.0% | 75.4% | 24.0 |
| Ancaster Heights/ Mohawk Meadows/ Maywood | $1,317,652 | $1,409,796 | -6.5% | 24.0% | 107.6% | 34.0 |
| Meadowlands | $1,181,985 | $1,143,956 | 3.3% | 40.5% | 104.9% | 35.0 |
| Parkview Heights | $1,394,677 | $1,276,235 | 9.3% | 50.3% | 147.2% | 16.0 |
| Dancaster/ Nakoma/ Maple Lane | $1,214,666 | $1,380,095 | -12.0% | 39.5% | 123.4% | 29.0 |
| Maple Lane Annex | $1,243,100 | $1,017,170 | 22.2% | 45.6% | 157.8% | 45.0 |
| Waterdown East | $1,226,818 | $1,167,896 | 5.0% | 51.5% | 131.6% | 18.0 |
| Heritage Green | $894,265 | $870,630 | 2.7% | 32.3% | 106.4% | 25.0 |
| Community Beach/ Fifty Point | $864,362 | $1,027,496 | -15.9% | 8.7% | 81.9% | 33.0 |
| Rural Glanbrook | $1,094,695 | $1,139,137 | -3.9% | 35.0% | 127.6% | 35.0 |
| HAMILTON | $1,142,294 | $1,124,373 | 2.70% | 34.50% | 117.0% | 30.1 |