Freehold Residential Sales Statistics
| Neighbourhood | Sale Price, Average 2025 | Sale Price, Average 2024 | % Price Change vs. 2024 | % Price Change vs. 5 Years | % Price Change vs. 10 Years | Days to Sell, Average 2025 |
|---|---|---|---|---|---|---|
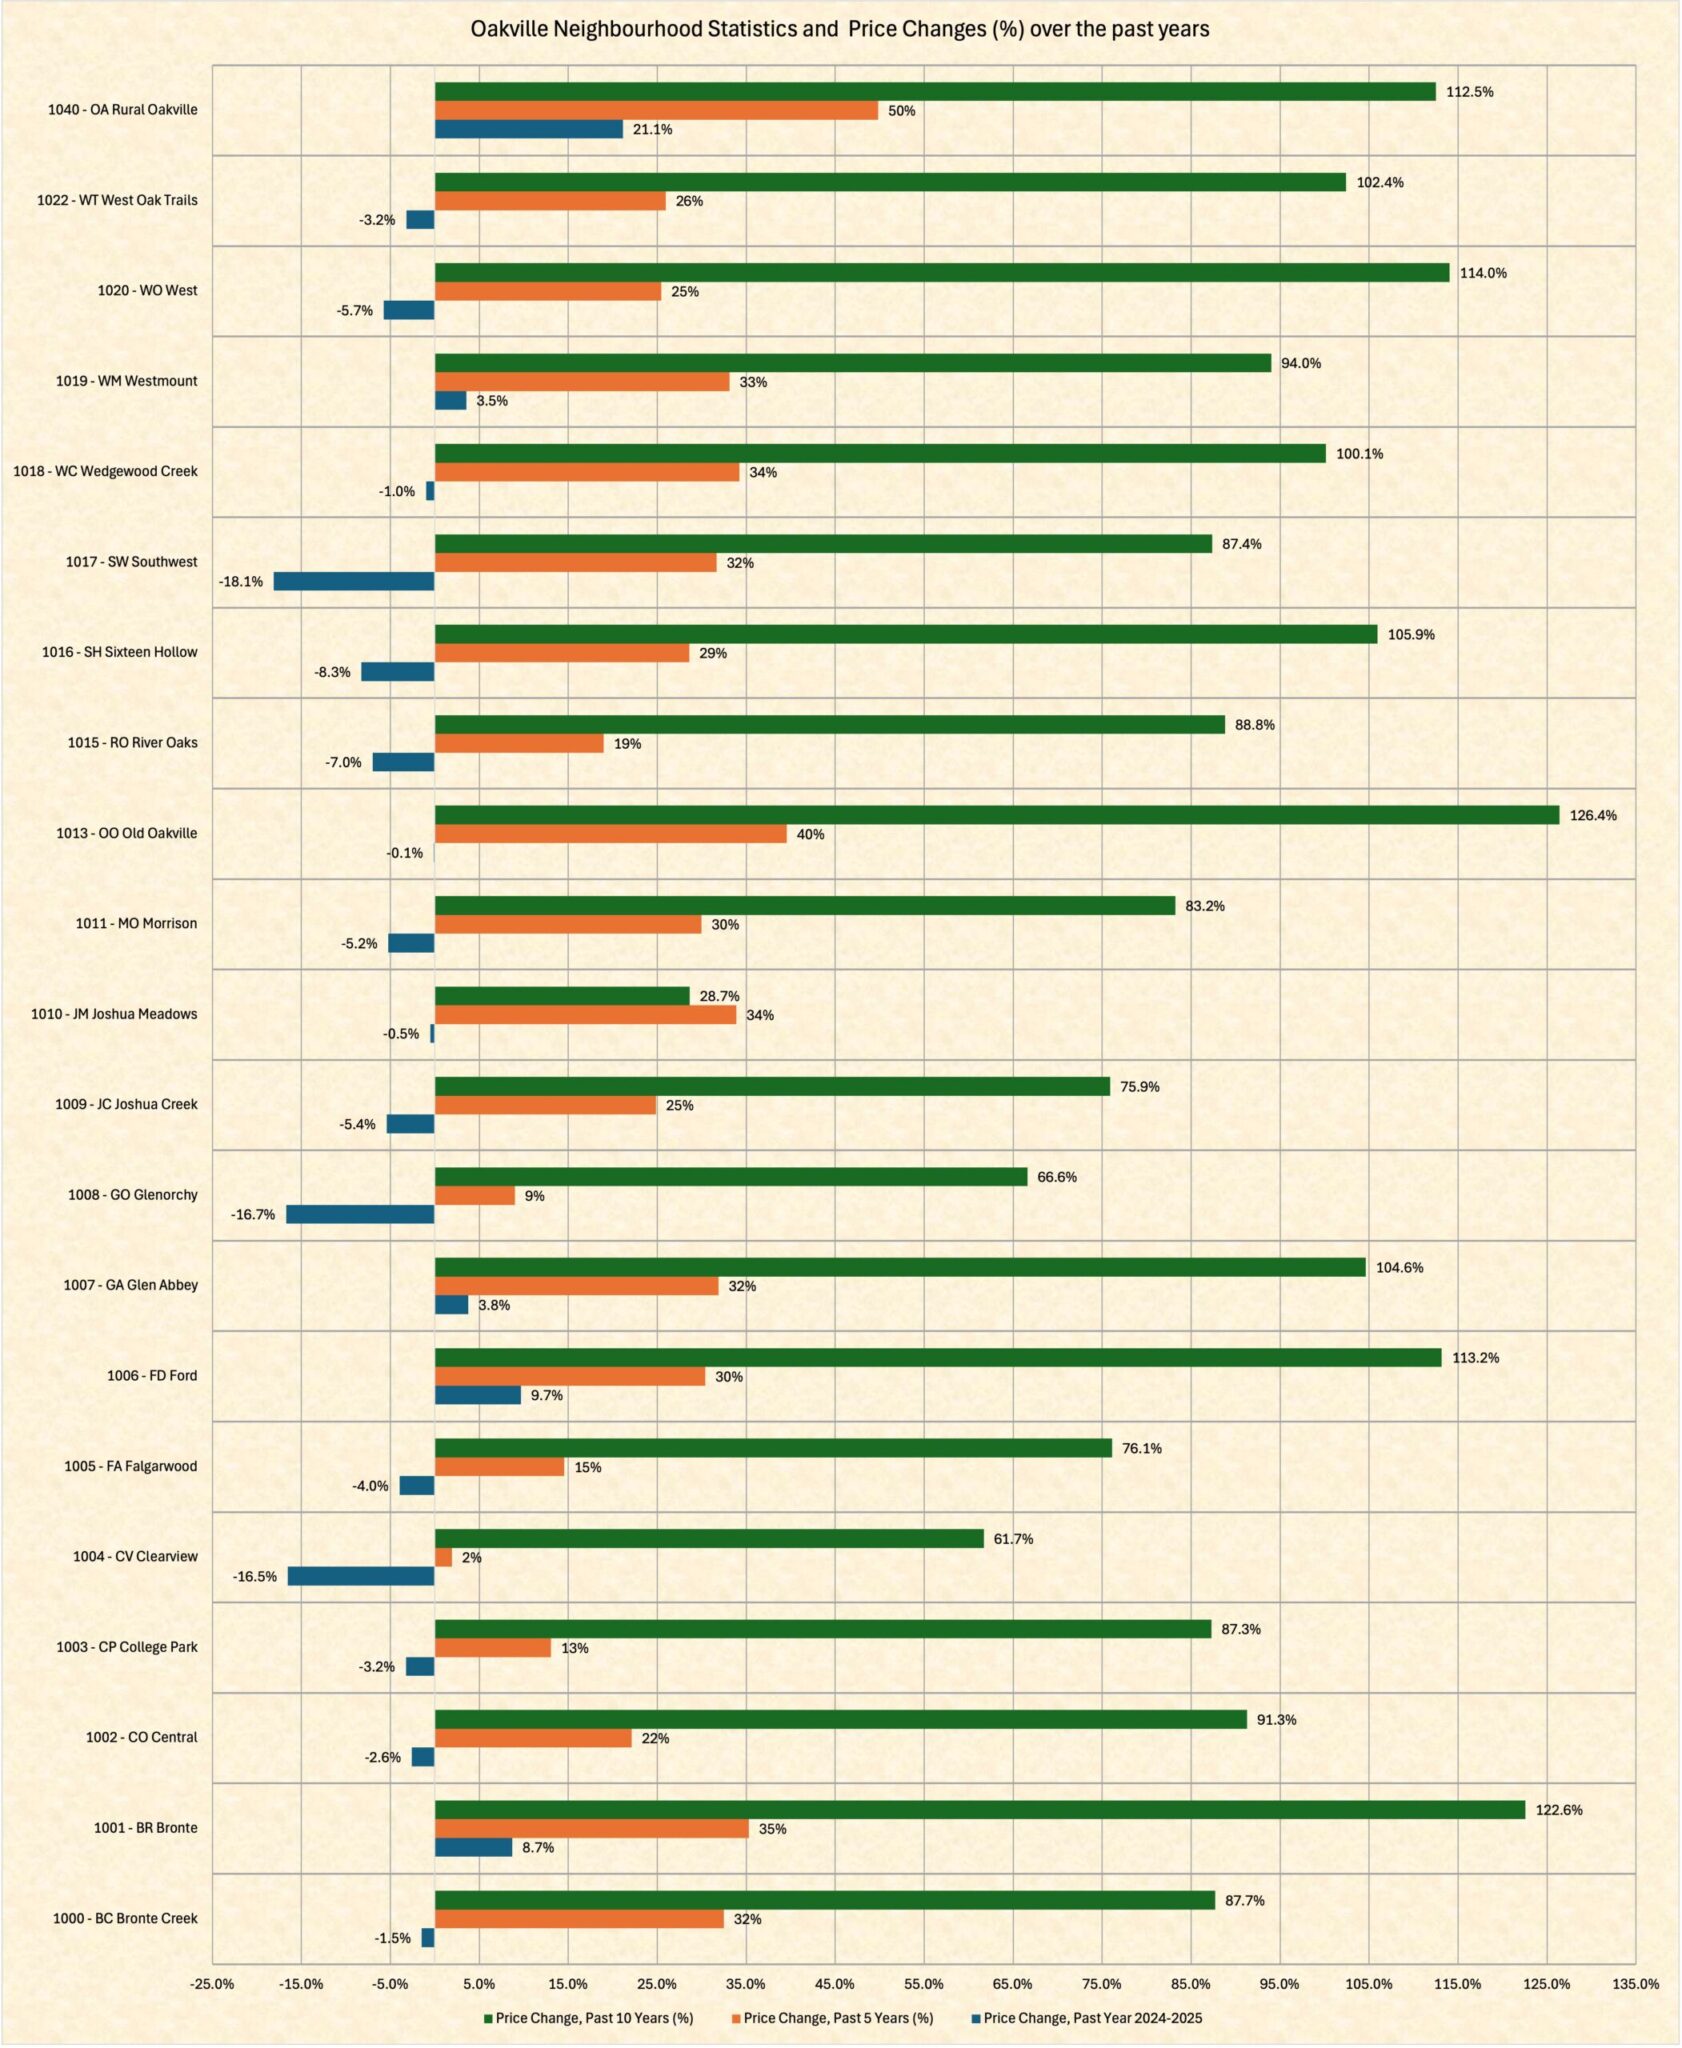
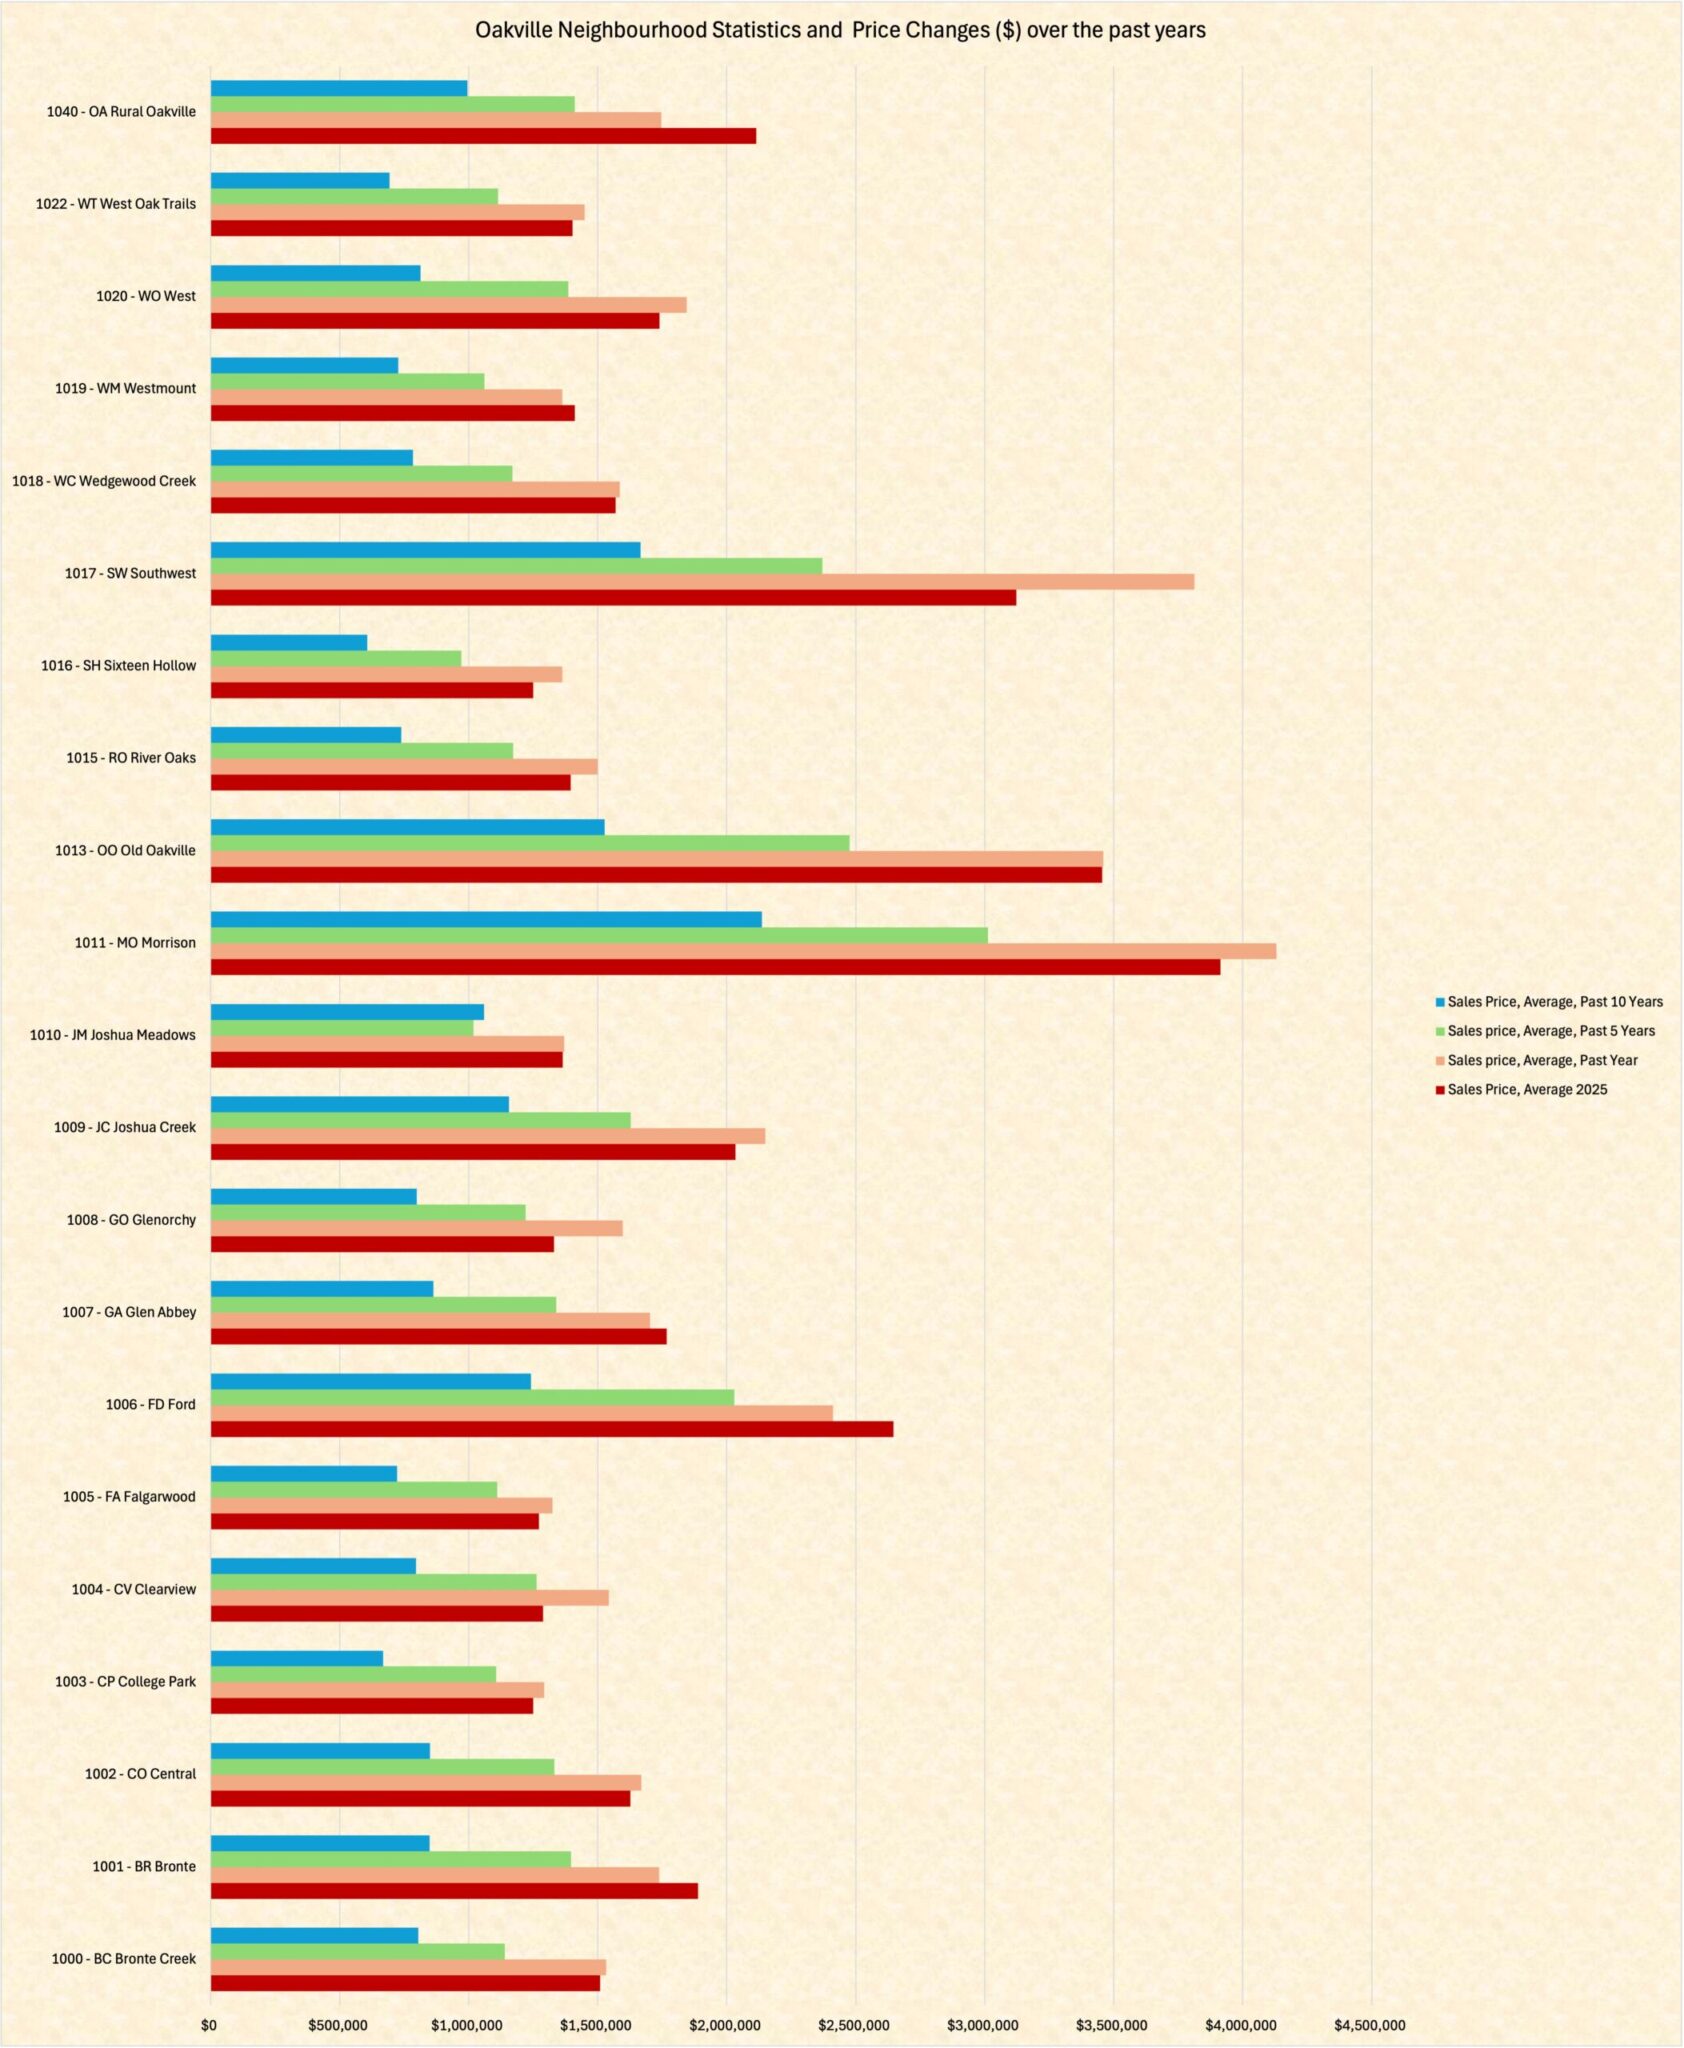
| Bronte Creek | $1,509,629 | $1,532,122 | -1.5% | 32% | 87.7% | 21.0 |
| Bronte | $1,888,486 | $1,737,242 | 8.7% | 35% | 122.6% | 37.0 |
| Central | $1,626,594 | $1,669,640 | -2.6% | 22% | 91.3% | 23.0 |
| College Park | $1,250,250 | $1,292,244 | -3.2% | 13% | 87.3% | 25.0 |
| Falgarwood | $1,271,755 | $1,324,317 | -4.0% | 15% | 76.1% | 32.0 |
| Ford | $2,645,885 | $2,412,161 | 9.7% | 30% | 113.2% | 23.0 |
| Glen Abbey | $1,766,810 | $1,702,493 | 3.8% | 32% | 104.6% | 19.0 |
| Glenorchy | $1,330,129 | $1,596,851 | -16.7% | 9% | 66.6% | 19.0 |
| Joshua Creek | $2,033,444 | $2,150,025 | -5.4% | 25% | 75.9% | 50.0 |
| Morrison | $3,914,505 | $4,130,530 | -5.2% | 30% | 83.2% | 36.0 |
| Old Oakville | $3,455,433 | $3,459,571 | -0.1% | 40% | 126.4% | 44.0 |
| River Oaks | $1,395,085 | $1,499,895 | -7.0% | 19% | 88.8% | 34.0 |
| Southwest | $3,122,115 | $3,812,145 | -18.1% | 32% | 87.4% | 15.0 |
| Wedgewood Creek | $1,569,206 | $1,584,919 | -1.0% | 34% | 100.1% | 23.0 |
| Westmount | $1,411,637 | $1,363,462 | 3.5% | 33% | 94.0% | 24.0 |
| West Oak Trails | $1,402,590 | $1,449,087 | -3.2% | 26% | 102.4% | 21.0 |
| West | $1,739,431 | $1,845,368 | -5.7% | 25% | 114.0% | 28.0 |
| Joshua Meadows | $1,363,771 | $1,370,844 | -0.5% | 34% | 83.2% | 27.0 |
| OAKVILLE | $1,873,786 | $1,932,577 | -4.7% | 27.0% | 91.9% | 27.8 |